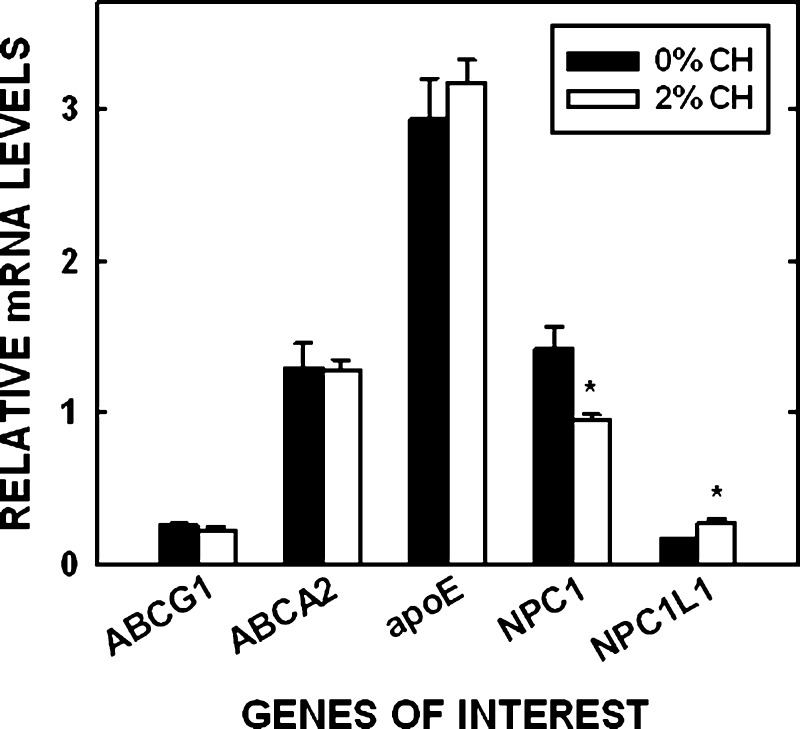
Fig. 6.
Relative mRNA levels in hamster placentas. Tissues were collected from dams treated as in Fig. 1. The relative amount of mRNA in the placenta compared with cyclophilin is presented. Data are presented as means (n = 5) ± SEM. The asterisk depicts significant differences between animals fed different diets.

