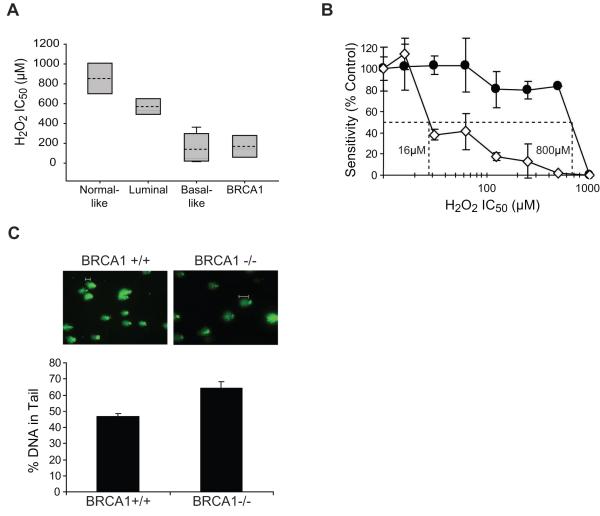
Figure 1. Increased ODD in basal-like and BRCA1-mutated breast cancer cell lines and in the presence of BRCA1 deficiency.
(A) Analysis of H2O2 sensitivity, an indicator of ODD, by MTT assay in cell lines representing the normal breast and each subtype of breast cancer. Each box plot summarizes the data described in Table 1. For each subtype, the grey shaded area indicates the range of IC50 values, the dashed line indicates the average IC50 value, and the solid line indicates the median IC50 value. (B) Analysis of H2O2 sensitivity by MTT assay in BRCA1+/+ (-●-) and BRCA1-/- (-◇-) MMECs. The graph illustrates sensitivity following treatment with increasing concentration of oxidizing agent. The IC50 concentrations as determined by interpolation from the dose-response curves are indicated for each cell line. (C) Basal levels of ODD in BRCA1+/+ and BRCA1-/- MMECs. ODD was measured by the alkaline comet assay modified for detection of oxidized bases using logarithmically growing cells. ODD was visualized by fluorescent microscopy (top), and quantified by measuring the percentage of DNA in comet tails using comet software (bottom). White bars indicate typical comet tails.

