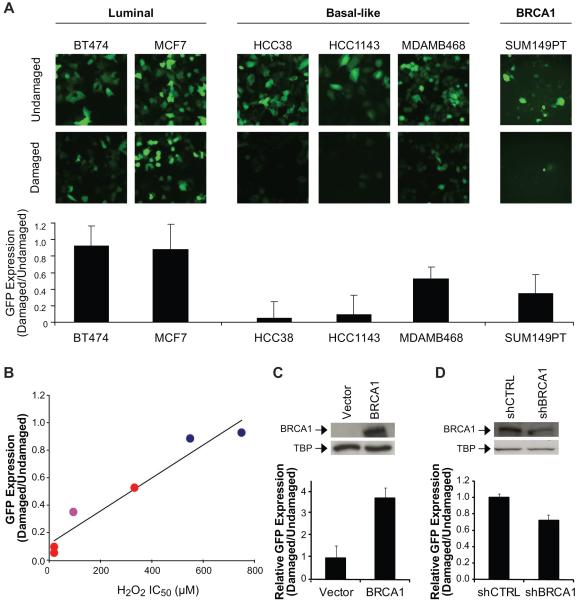
Figure 2. Decreased BER activity in basal-like and BRCA1-mutated or deficient breast cancer cell lines.
(A) BER activity in cell lines representing each subtype of breast cancer using a cell-based BER assay. GFP expression, i.e. an indicator of BER activity, was observed by fluorescent microscopy (top), and quantified by plate reading (bottom). Images were collected under 10X objective and are representative. (B) Relationship between H2O2 sensitivity and BER in breast cancer cell lines. Cell lines included: luminal  , basal-like
  , and BRCA1-mutated
  . The plot depicts linear regression of the average IC50 value obtained from MTT analysis of H2O2 sensitivity and GFP expression quantified following the BER assay. (C) BER activity in the SUM149PT breast cancer cell line (mutant BRCA1) transfected with wild-type BRCA1. In the top panel, Western blot illustrates nuclear expression of wild-type BRCA1. Tata-binding protein (TBP) was used as a nuclear loading control. In the bottom panel, each bar represents the expression of GFP as determined by the BER assay, which was quantified using a fluorescent plate reader and calculated relative to the vector control. (D) BER activity in the MDAMB361 breast cancer cell line (wild-type BRCA1) transfected with shRNA to BRCA1. Expression of BRCA1 (top) and GFP (bottom) were determined as in (C).

