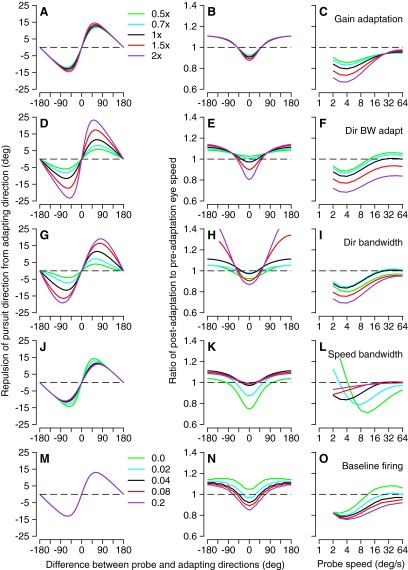
FIG. 11.
Effect of selecting outputs from different subsets of MT neurons on the predictions of the joint vector averaging decoding model for behavioral adaptation. From left to right, the columns of graphs show adaptation of pursuit direction as a function of the difference between probe and adapting directions, adaptation of pursuit speed as a function of the difference between probe and adapting conditions, and adaptation of pursuit speed as a function of probe speed when adapting speed was 16°/s. The 5 rows show the effect of varying 5 different features of the population responses, according to the labels at the right of each row. Different colored traces show predicted adaptation for different sets of parameters, according to the keys to the right of A and M. Key in A applies to A–L and each entry indicates the multiplication factor applied to the mean for the parameter varied in a given plot; key in M applies to M–O and each entry indicates the value of the baseline firing as a fraction of the maximum response of each model neuron.

