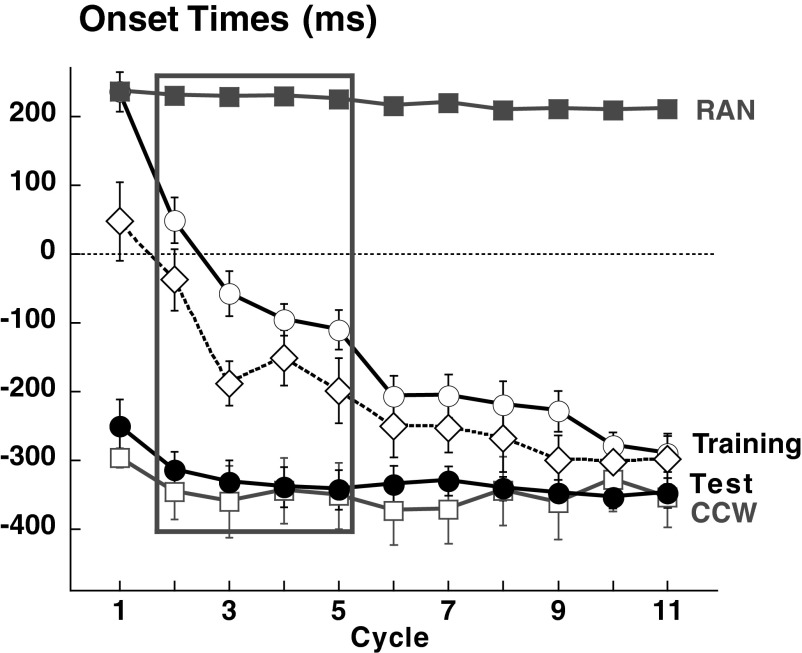
FIG. 4.
Onset times for control groups 1 and 4 combined. Mean onset times (±SE) per cycle plotted for RAN (filled gray squares), CCW (empty gray squares), SEQAtrain (empty circles), and SEQAtest (filled circles). Empty diamonds and dotted lines represent the mean for correct anticipatory movements in SEQAtrain. Data were combined for the 2 control groups because there was no significant difference between them. Learning during SEQAtrain is shown by the progressive reduction in onset time across cycles. There was a significant difference between SEQAtrain and RAN, CCW, and SEQAtest (all P < 0.0001), but not between SEQAtest and CCW (P = 0.98).

