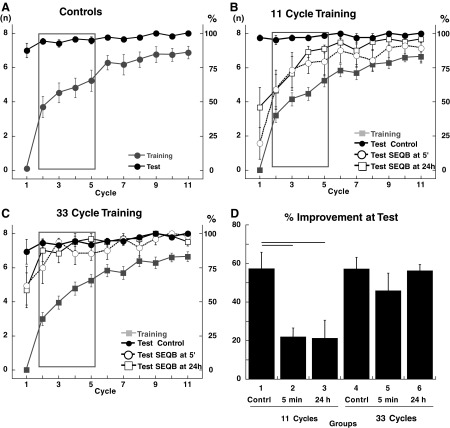
FIG. 5.
Correct anticipatory movements for SEQA. A: control groups 1 (11 cycles of training) and 4 (33 cycles of training). Correct anticipatory movements (mean ± SE) per cycle plotted for SEQAtrain (filled gray circles) and SEQAtest (filled black circles). Data were combined for the 2 control groups because there was no significant difference between them. B: groups 1, 2, and 3 (11 cycles of training). There was no significant difference in SEQAtrain for the 3 groups (P > 0.8) and data were combined (filled gray squares). Correct anticipatory movements for SEQAtest plotted separately for groups 1 (filled black circles), 2 (empty black circles), and 3 (empty black squares). C: groups 4, 5, and 6 (33 cycles of SEQAtrain). There was no significant difference in SEQAtrain for the 3 groups (P > 0.8) and data were combined (filled gray squares). Correct anticipatory movements for SEQAtest plotted separately for groups 1 (filled black circles), 2 (empty black circles), and 3 (empty black squares). D: savings at Test (% improvement in cycles 2–5). Each bar represents the mean ± SE for each group. ANOVA showed a main effect for amount of training [F(1,30) = 10.92, P = 0.002] and a main effect for groups [F(2,30) = 6.4, P = 0.005]. Post hoc tests showed significant (P < 0.003) differences between groups 2 and 3 and groups 1, 4, 5, and 6.

