
FIG. 2.
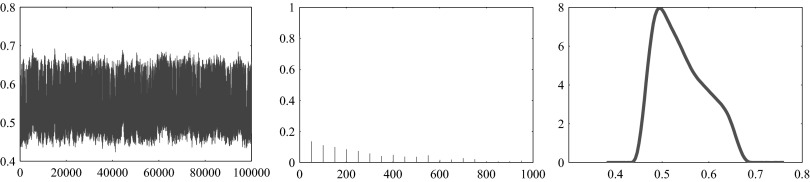
Example of diagnostics of the convergence of the sample. Sample history (left), autocorrelation function (center), and histogram (right) for the reaction flux ΦGLC→G6P are shown. The width of the histogram gives an indication about how tightly the variable is estimated.