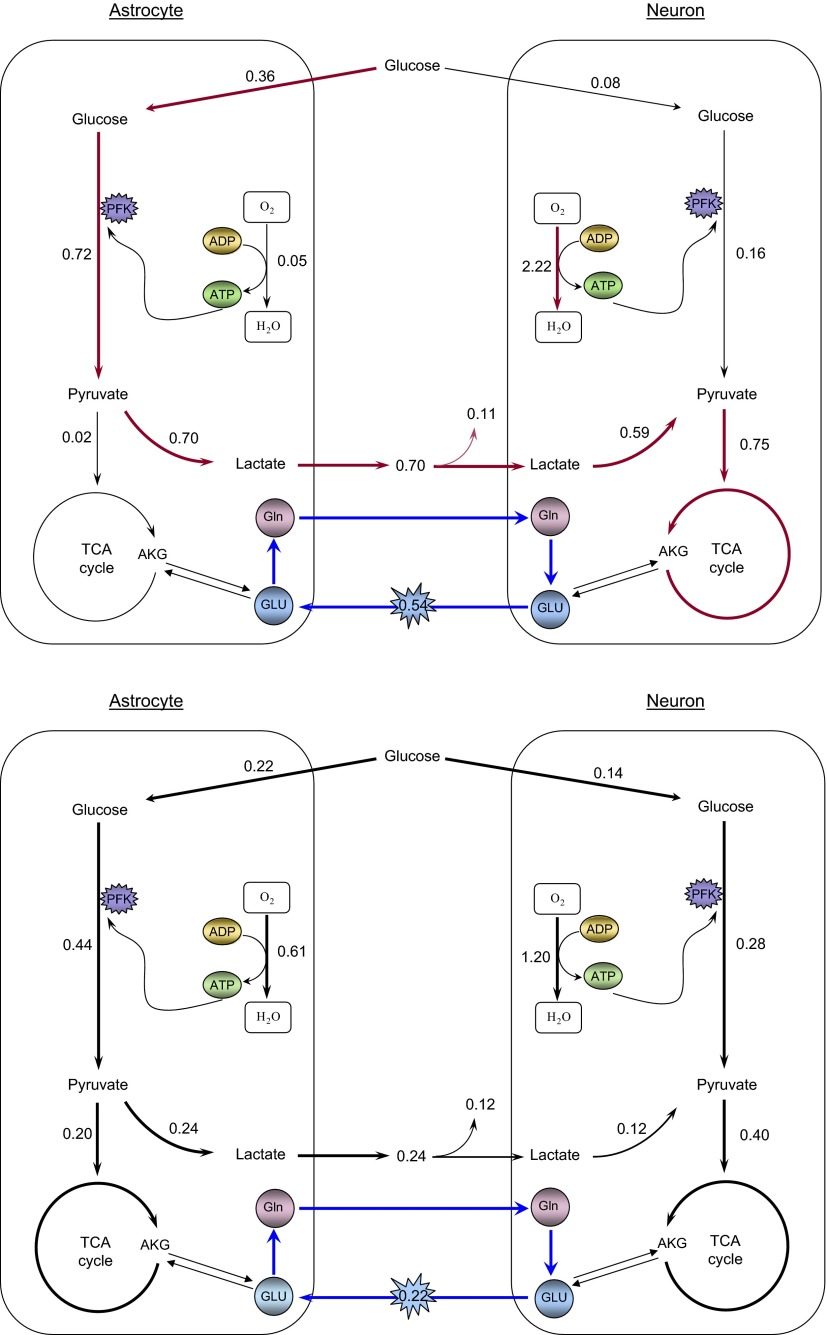
FIG. 3.
Schematics of preferred biochemical pathways in astrocyte and glutamatergic neuron during high (top) and low (bottom) neuronal activity. The values by the arrows are the mean values in μmol·gtissue−1·min−1 of the reaction and transport rates of the Markov Chain Monte Carlo (MCMC) sample generated from our computational model.

