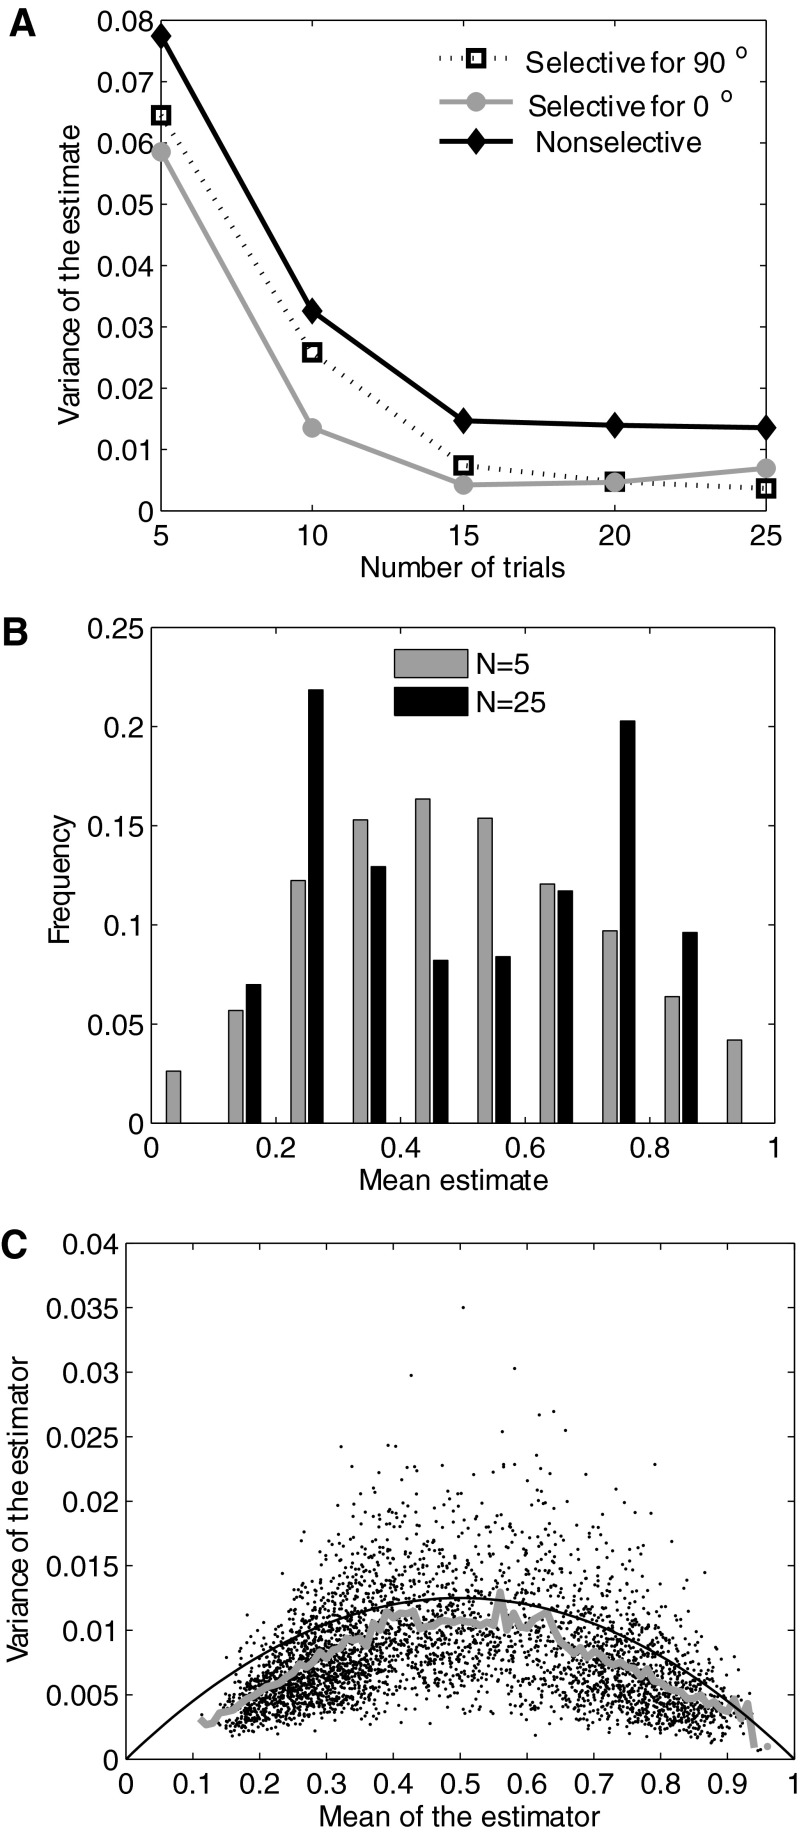
FIG. 7.
Consistency, asymptotic bias, and efficiency of the probability estimator. A: variance of the estimate is plotted against the number of trials for a pixel inside an activation domain for 0° (gray line), for 90° (broken line), and for a pixel not selective for either orientation (black line). Each point represents the variance computed from 100 repeated estimates of the probability using random sampling without replacement of the corresponding number of pairs of reflectance values. B: distribution of the mean probability estimates from the same simulations are shown for 5 and 25 pairs of reflectance values. C: relationship between mean and variance of the probability estimates. The moving average (gray line) is close to the variance of the maximum likelihood estimator for the probability value.

