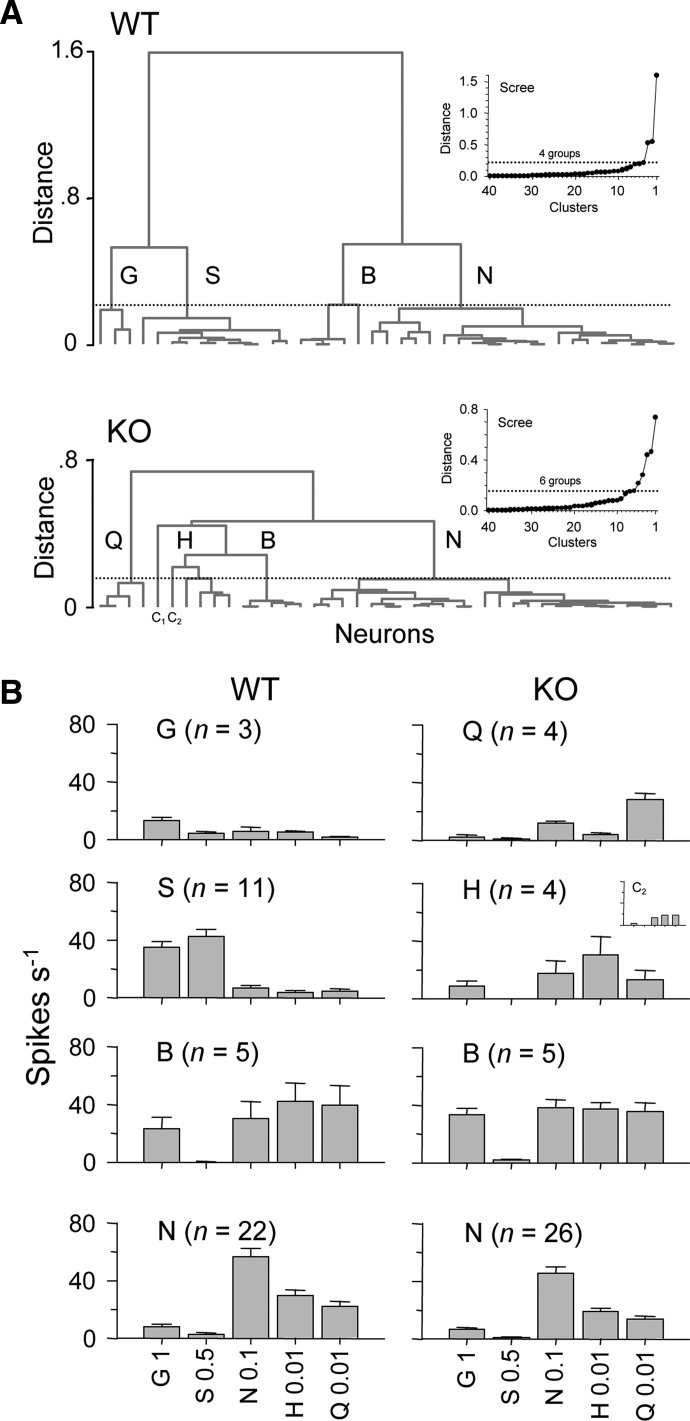
FIG. 7.
Identifying neuron types among WT and KO cells. A: dendrogram trees showing the outcome of hierarchical cluster analyses applied to delineate trends in tuning orientations among WT and KO neurons. Scree plots used to “cut” tuning clusters from each tree are shown as insets. B: mean ± SE responses to (in M) 1 glycine, 0.5 sucrose, 0.1 NaCl, 0.01 HCl, and 0.01 quinine in WT and KO neural groups identified by cluster analyses in A. The profile C2 shown with the KO groupings represents the activity of a single cell placed into its own group but with a response profile most similar to that of group H.

