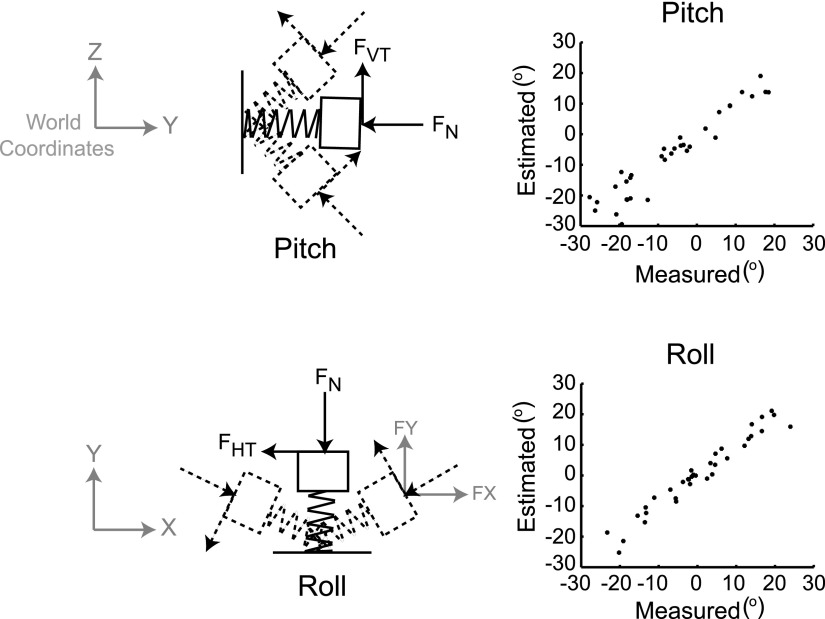
FIG. 2.
Spring calibration. Panels in the left column show possible pitch and roll rotations of the transducer surface and the changes in the orientation of the forces measured at the transducer due to these rotations. The right column shows the results of the calibration, with the estimated pitch and roll angles plotted against the actual measured angles.

