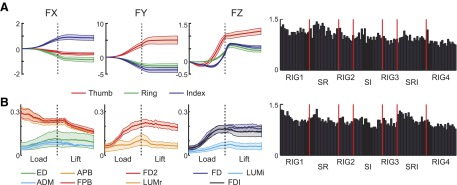
FIG. 5.

Mean force and electromyographic (EMG) patterns. The mean ± SE force (A) and EMG (B) patterns computed across all subjects are shown in the first 3 columns. The weighting for each trial (computed by regressing individual trial data onto the mean) is shown in the 4th column with vertical red lines separating blocks of trials.
