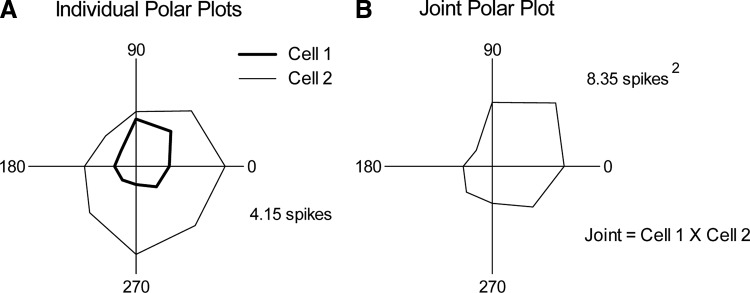
FIG. 2.
Calculation of joint angular tuning. A: trial-averaged polar plots for 2 individual members of a cell pair. B: joint tuning polar plots constructed on a trial-by-trial basis, by multiplying the spike count of cell 1 with that of cell 2 and then summing across repetitions of the same angle. Spike counts of each plot indicate the magnitude of the maximal response.

