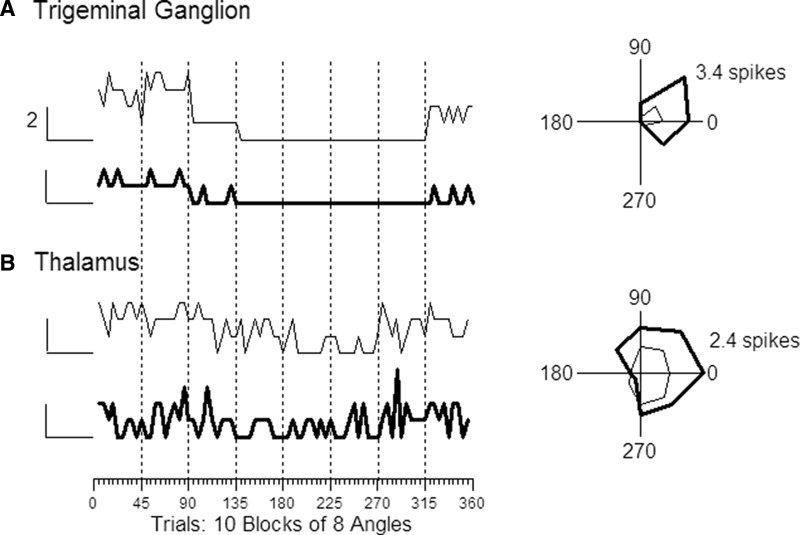
FIG. 3.
Trial-by-trial responses (left) and trial-averaged polar plots (right) for a pair of trigeminal ganglion cells (A) and a pair of thalamocortical single units (B). Although stimuli were delivered pseudorandomly with respect to deflection angle (see methods), same-angle deflections are plotted successively (n = 10) at each of the 8 deflection angles; data points are connected by solid lines for ease of visualization. Vertical scale = 2 spikes applies to all 4 traces; baseline (0 spikes) is indicated by the short horizontal bar to the left of each trace. Orientation of polar plots: 0° = caudal, 90° = dorsal. The more responsive trigeminal ganglion cell fired an average of 3.4 spikes with 45° deflections; the more responsive thalamic cell fired 2.4 spikes at 0°.

