
FIG. 1.
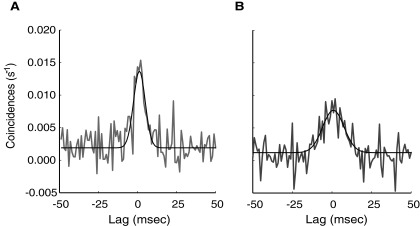
Examples of cross-correlation histograms (CCHs) for preferred and blank stimulus conditions. A: CCH in response to the preferred stimulus. B: CCH from the same neuron pair in response to the blank stimulus. The CCHs were corrected with the jitter correction method. On qualitative examination, it was evident that whereas the lags were similar for these 2 CCHs, they had different amplitudes and widths. For this neuron pair, the blank stimulus CCH was lower in amplitude (0.0079 vs. 0.0134 s-1) and broader in width (17.2 vs. 9.8 ms) than the preferred stimulus CCH. Gray line, CCH; black line, best fit Gaussian curve.