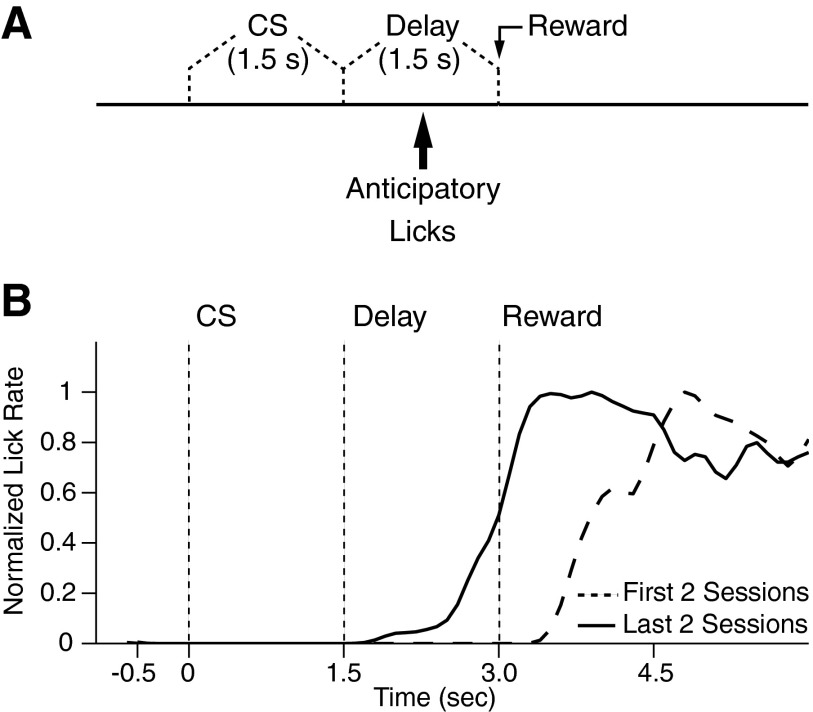
FIG. 2.
Trace conditioning task. A: relative timing of the visual CS, delay period, and reward delivery in the trace conditioning task. B: average lick frequency (y axis) as a function of time (x axis) during trace conditioning trials of the 1st 2 (- - -) and last 2 (—) training sessions in one cat. To facilitate comparison between licking behavior at early and late stages of training, the data were normalized to the peak licking frequency. All cats showed significant increase in anticipatory licking behavior during the late sessions (t-test, P < 0.05 for all cats).

