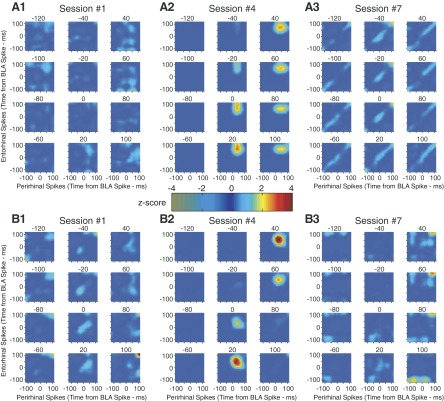
FIG. 4.
Impact of joint BLA-mPFC activity on rhinal correlations. Each group of 12 matrices is a correlation cube derived from 1 recording session but sliced in 20-ms bins along the z axis (time of mPFC spikes). Thus each matrix shows correlations between perirhinal spikes (x axis) and entorhinal spikes (y axis) at different delays (10-ms bins) relative to BLA spikes (at time 0, 0) and relative to mPFC spikes. For 2 animals (A, 1–3, and B, 1–3), we show the 1st (A1 and B1), 4th (A2 and B2), and 7th (A3 and B3) training sessions.

