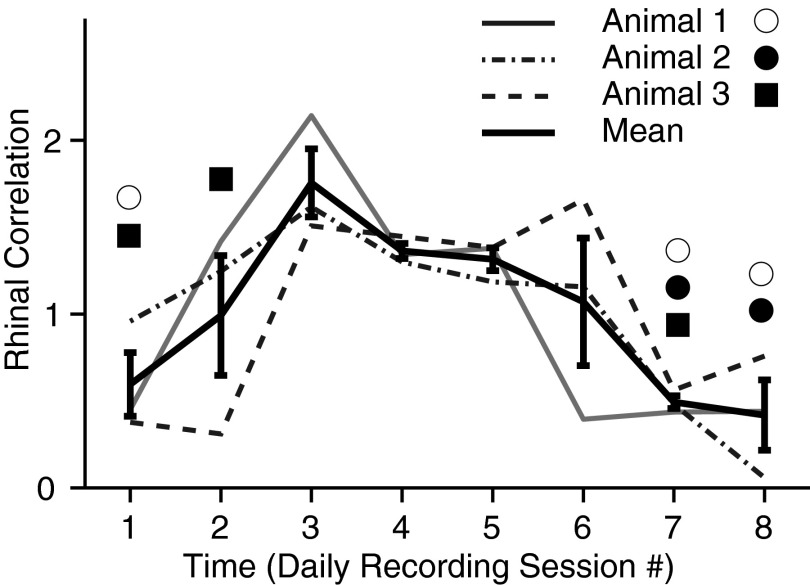
FIG. 5.
Different animals show similar time-dependent shifts in magnitude of mPFC-BLA based rhinal correlations. The graph plots magnitude of perirhinal-entorhinal correlations (y axis) as a function of daily recording sessions (x axis). The magnitude of perirhinal-entorhinal correlations was estimated by computing a ratio of the counts of coincident rhinal (peri- and entorhinal) spikes after vs. before joint BLA and mPFC spiking. There are 4 superimposed curves, one for each the 3 animals. The 4th (thick) curve is the average ± SE of the 3 subjects. Symbols mark sessions where the correlation cubes did not reach significance, coded by cat as indicated in the legend.

