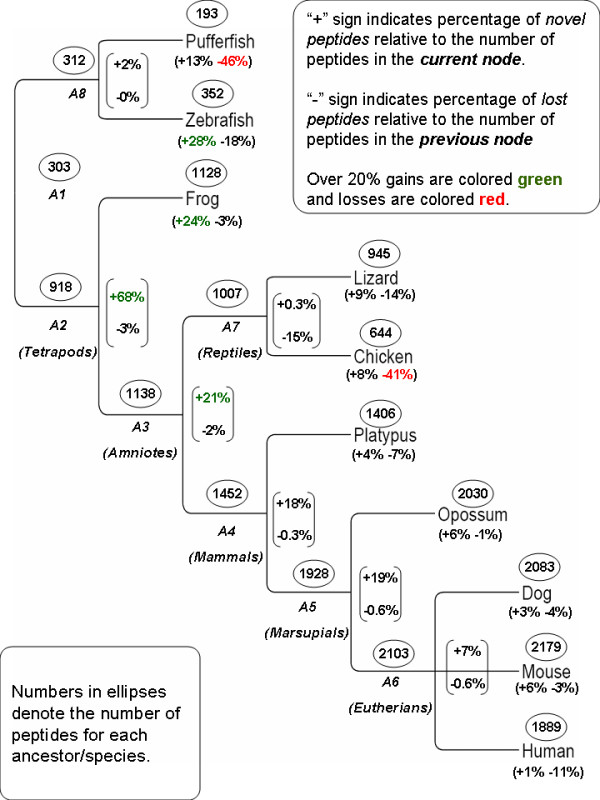
Figure 1.

CP reconstruction on the tree of life. Number of CPs occurring in each species and parsimoniously estimated number of CPs occurring in each ancestor (in ellipses). Numbers in brackets indicate the percentage of novel CPs relative to the total number of CPs in the current node (+ sign) and the percentage of lost CPs relative to the total number of CPs in the previous node (- sign). Over 20% gains are colored green and lost are colored red. Ancestor names are enumerated from the most recent ancestor of fish and tetrapods (A1) to pufferfish and zebrafish ancestor (A8). As an example, zebrafish contains 97 novel CPs, which constitute 28% out of its 352 CPs. It also lost 57 CPs, which occurred in its ancestor, which constitute 18% of the CPs existing in A8.
