Figure 6.

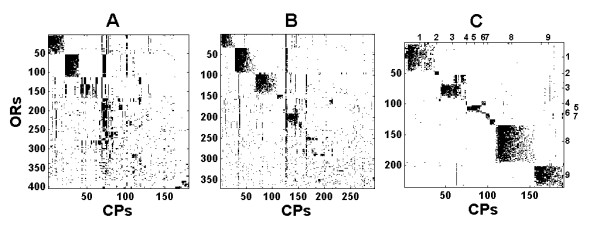
Biclustering results of Frog. Y-axis corresponds to ORs and X-axis to CPs novel to A1 (A), to A2 (B) and CPs novel to frog (C).

Biclustering results of Frog. Y-axis corresponds to ORs and X-axis to CPs novel to A1 (A), to A2 (B) and CPs novel to frog (C).