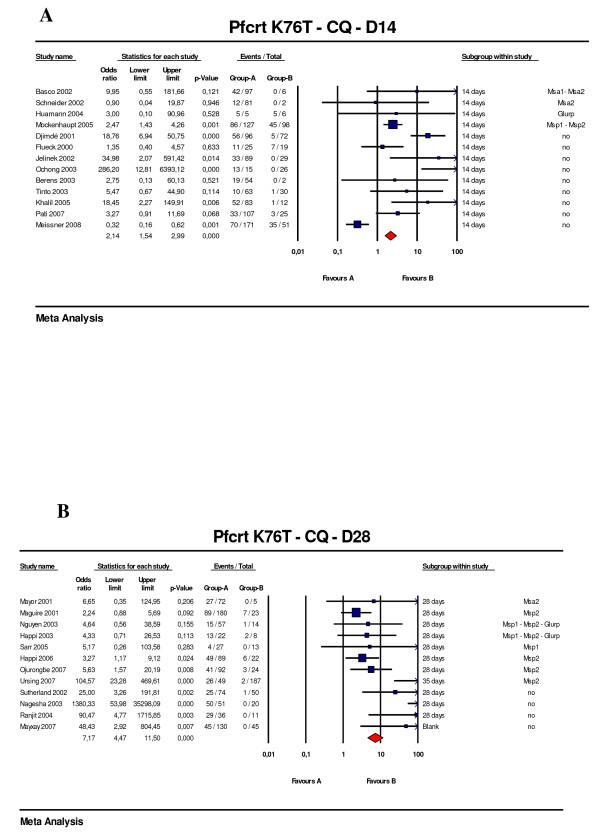
Figure 4.
Pfcrt K76T predictive value of therapeutic failure with chloroquine. (A) Studies with 14 days follow-up (B) Studies with 28 days follow-up. Odds ratios (95% CI), forest plots and studies description are similar to previous figures. One study with day 35 end point was included in the day 28 list since the difference seems to be weak in terms of late failure rate.

