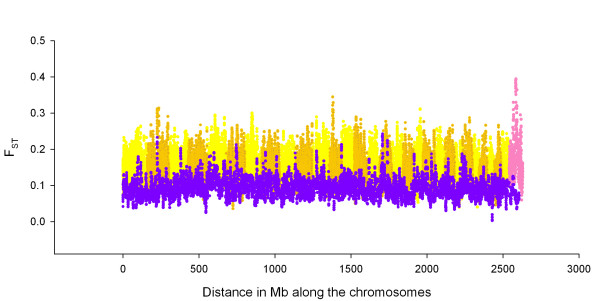
Figure 2.
Genome wide picture of positive selection. The distribution of FST for all breeds calculated in a sliding 8 SNP window along the chromosomes, with the Bovine HapMap values plotted on the same axes as the values calculated in the Australian cattle sample, for all loci in each study. The FST values of the Bovine HapMap sample are noted in yellow and ochre for odd and even autosomes respectively with the X chromosome in magenta. The FST values of the Australian cattle sample are noted in purple. Extremely high values represent likely instances of divergent selection and extremely low values represent likely instances of balancing selection.

