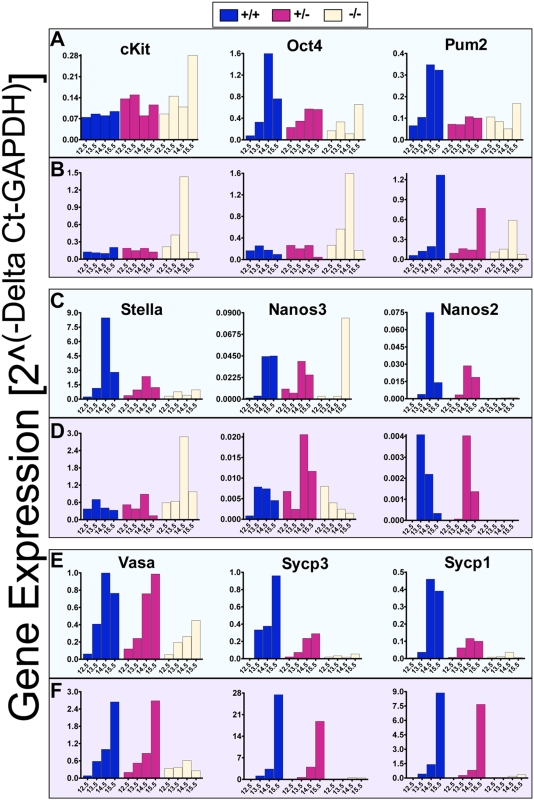
Figure 2. Aberrant Germ Cell Gene Expression in the Germ Cells of Dazl Mutants.
Expression profiles are shown in isolated germ cells at E12.5, E13.5, E14.5, and E15.5. Males are displayed in green boxes (A), (C), and (E). Females are displayed in purple boxes (B), (D), and (F). cKit, Oct4, Pum2 (Pumilio2), Stella, Nanos3, and Nanos2 represent genes, which are expressed beginning in migrating PGCs, while Vasa, Sycp3 (Synaptonemal complex protein 3), and Sycp1 (Synaptonemal complex protein 1) represent meiotic markers. Expression levels on the y-axis are normalized to the GAPDH housekeeping gene. Each bar on the graph represents average expression of sorted germ cells from the following number of embryos. Males: E12.5 +/+ (N = 3), +/− (N = 13), −/− (N = 5); E13.5 +/+ (N = 4), +/− (N = 8), −/− (N = 3); E14.5 +/+ (N = 2), +/− (N = 17), −/− (N = 3); E15.5 +/+ (N = 7), +/− (N = 10), −/− (N = 3). Females: E12.5 +/+ (N = 5), +/− (N = 7), −/− (N = 6); E13.5 +/+ (N = 3), +/− (N = 5), −/− (N = 4); E14.5 +/+ (N = 8), +/− (N = 15), −/− (N = 4); E15.5 +/+ (N = 7), +/− (N = 7), −/− (N = 4). Note the Y-axis on all graphs display different scales.

