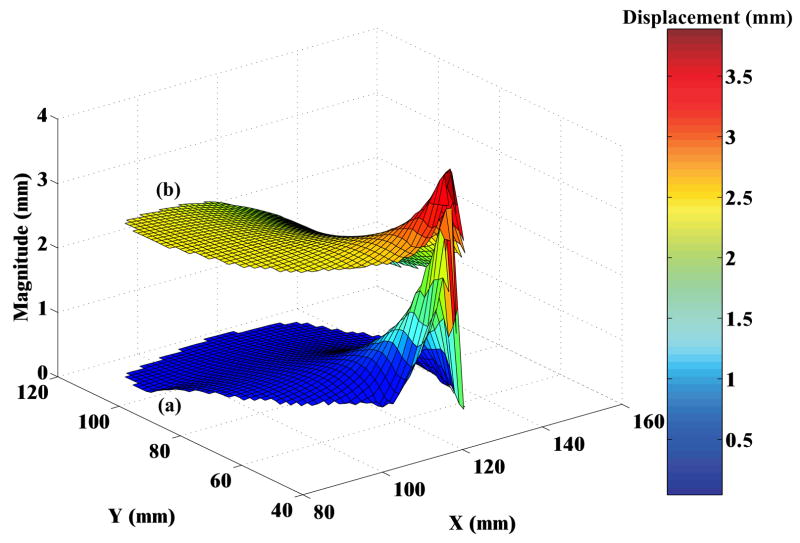
Fig. 11.
Surface plots depicting the magnitude of nodal displacements for the prostate, where X and Y axes represent the nodal co-ordinates of the prostate in the FE model. (a) Simulation with complex anatomy and boundary conditions (NoCoh) and (b) simulation with simple organ geometry and boundary conditions (Crop). For both simulation cases relative motion between the prostate and surrounding tissue is not modeled.

