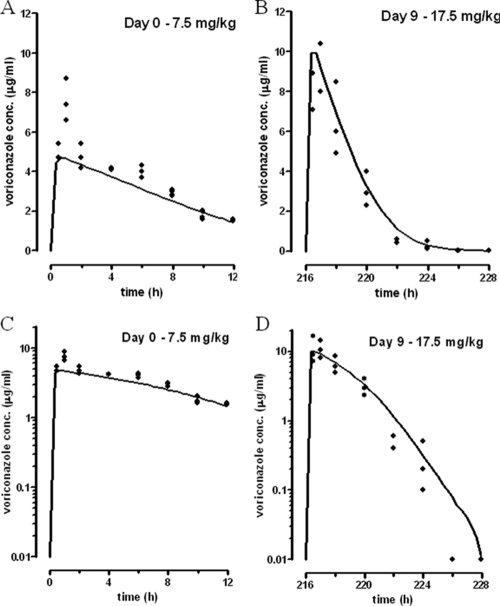
FIG. 1.
Measured VOR plasma concentrations (dots) on day 0 (A and C) and day 9 (B and D) following doses of 7.5 and 17.5 mg/kg, respectively. The solid lines represent the concentration profile as predicted on basis of the population pharmacokinetic parameters presented in Table 2. In the logarithmic plots (C and D) the convex shape of the curves clearly demonstrates saturable metabolism. The elimination slope increases with diminishing concentrations. In comparison with day 0 the rate of elimination (Vmax) is increased on day 9 due to enzyme induction. At comparable concentrations the elimination slope is steeper on day 9. In order to compensate for the increased elimination rate, a larger dose was given on day 9 (17.5 mg/kg versus 7.5 mg/kg), which produces higher maximal concentrations but comparable exposure. See linear plots (A and B) with respective values of the AUC12 of 37.2 and 33.0 μg·h/ml.

