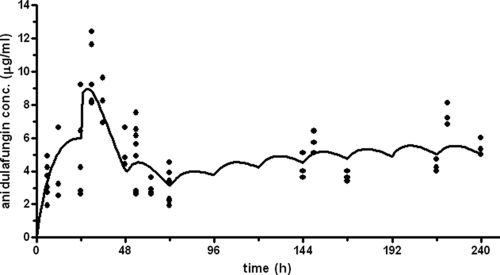
FIG. 3.
Measured ANI plasma concentrations (dots) following a loading dose of 20 mg/kg and once-daily doses of 5 mg/kg. The solid line represents the concentration profile as predicted by the developed pharmacokinetic model (Table 3). Clearance on days 1 and 2 was increased compared to day 0 and day 9.

