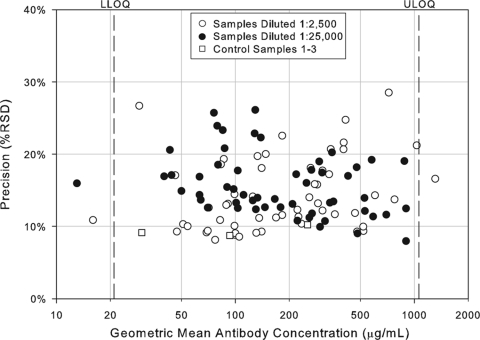
FIG. 2.
Precision profile of control and test samples in the IsdB serologic assay. Assay precision was estimated by combining intra- and interassay variability across the 108 assay plates. The precision estimates for each of the 55 samples tested in the IsdB serologic assay at the 1:2,500 and 1:25,000 dilution and the control samples are shown as a function of antibody concentration and are expressed as the percent RSD.

