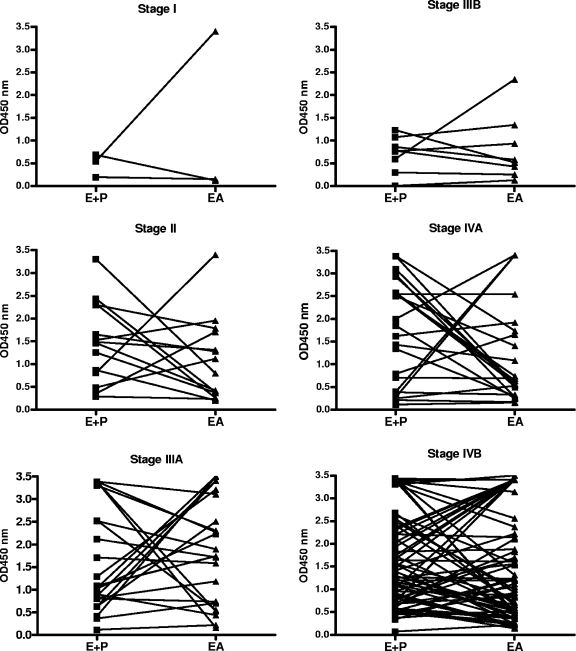
FIG. 3.
IgA [EBNA1+VCA p18] and IgA EA ELISA values for NPC patients at different stages of the disease. For each case, lines interconnect OD450 values in both ELISA systems. This reveals a generally different response level in either test, indicating that both ELISA systems detect distinct EBV IgA reactivities and may function for complementary serological testing.

