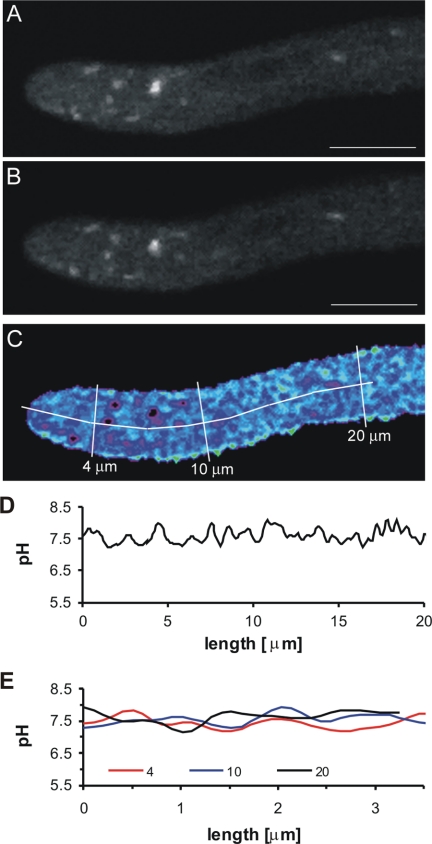
FIG. 4.
Intracellular pH analysis of a growing hyphal tip expressing RaVC from the margin of an 18-h-old colony. The images are median optical sections through the hyphal tip and were captured sequentially. (A) Image of RaVC fluorescence (500 to 530 nm) after excitation at 405 nm. (B) Image of RaVC fluorescence (500 to 530 nm) after excitation at 476 nm. (C) Pseudocoloured ratio image of the fluorescence intensities of RaVC after a pixel-by-pixel calculation using equations 1 and 2 (see Materials and Methods). Black intracellular regions represented regions in which the fluorescent signal was saturated, preventing the accurate determination of intracellular pH. (D) Intracellular pH along the longitudinal transect shown in panel C. (E) Intracellular pH along the transverse transects shown in panel C. Bar = 5 μm.

