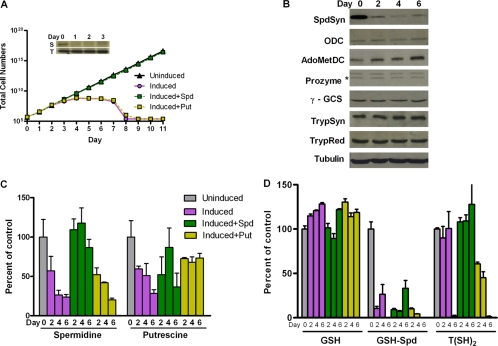
FIG. 2.
Effects of the RNAi-mediated silencing of the SpdSyn gene. (A) Cell growth curves. Total cell numbers calculated as the product of cell density and the total dilution factor are plotted versus time (days) post-Tet induction (1 μg/ml) in the presence or absence of spermidine (Spd; 0.1 mM) or putrescine (Put; 0.5 mM). The inset shows Northern analysis for SpdSyn (S panel) and the tubulin control (T panel). Data shown are the averages of the results from two experiments. (B) Western blot analysis of the polyamine and trypanothione biosynthetic pathway enzymes. (C) Intracellular polyamine levels. (D) Intracellular thiol levels. Uninduced SpdSyn RNAi cells are included as a control. Errors represent the standard errors of the means of the results from three independent biological replicates.

