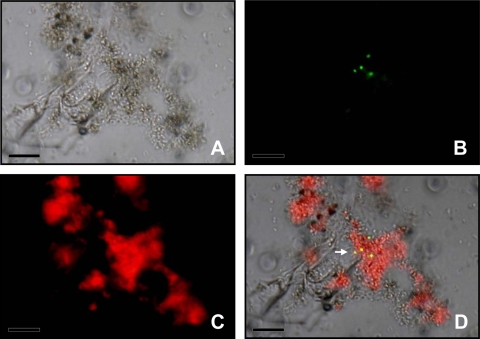
FIG. 4.
Visualization of A. baylyi transformants in the residuesphere of transplastomic tobacco plant. (A) Bright-field image showing plant debris and bacterial cells; (B) A. baylyi transformants expressing GFP after restoration of the promoter activity through HGT between the plant and the bacteria; (C) red fluorescence emitted by the chloroplasts; (D) images obtained with the different filter sets were combined to provide spatial context for transformant localization. The arrow points at four transformed bacterial cells. Bars = 10 μm.

