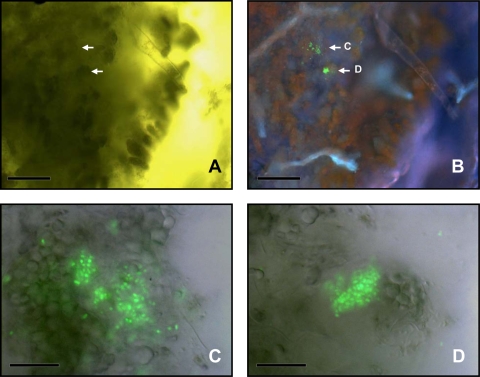
FIG. 5.
Visualization of A. baylyi transformants in the residuesphere of transplastomic tobacco plant. (A) Bright-field image; arrows point at the localization of transformants. (B) Epifluorescence micrograph of the same field of view showing A. baylyi transformants expressing GFP (green), chloroplasts (red), and veins (cyan). (C, D) Details showing cell clusters of A. baylyi transformants expressing GFP after restoration of the promoter activity through HGT between the plant and the bacteria. Panel A and B bars, 50 μm; panel C and D bars, 20 μm.

