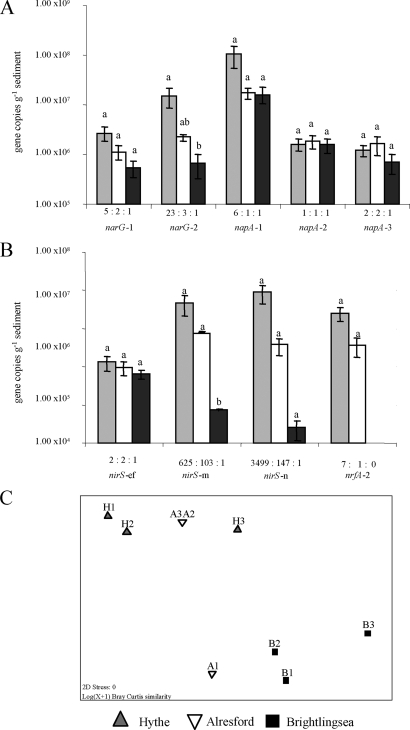
FIG. 2.
Variation in abundance (number of copies per gram of sediment) of nitrate and nitrite reductase genes along the Colne estuary in February 2005. (A and B) Data are shown for nitrate reductase genes narG and napA (A) and nitrite reductase genes nirS and nrfA (B). Details of the subgroups targeted by the Q-PCR primers and probes are given by Smith et al. (38). Standard errors (n = 3) for each separate Q-PCR assay are shown, and for each phylotype, statistically significant differences (P < 0.005) between sites are indicated by different letters. The ratios of gene numbers at the three sites are displayed for each phylotype. nrfA-2 genes were not detected below the CT cutoff value at the Brightlingsea site. Gene numbers were calculated from the following standard curves: narG-1, r2 = 0.995, y intercept = 40.52, and E = 100.9% (NTC undetected); narG-2, r2 = 0.999, y intercept = 44.57, E = 90.9%, and CT cutoff = 32.3; napA-1, r2 = 0.998, y intercept = 44.99, and E = 86.9% (NTC undetected); napA-2, r2 = 0.997, y intercept = 39.00, E = 89.6%, and CT cutoff = 32.83; napA-3, r2 = 0.996, y intercept = 47.60, and E = 89.2% (NTC undetected); nirS-e&f, r2 = 0.998, y intercept = 35.89, E = 86.0%, and CT cutoff = 35.00; nirS-m, r2 = 0.996, y intercept = 41.13, and E = 86.1% (NTC undetected); nirS-n, r2 = 0.998, y intercept = 42.84, and E = 82.1% (NTC undetected); and nrfA-2, r2 = 0.997, y intercept = 39.89, E = 96.06%, and CT cutoff = 28.51. (C) MDS plot of Bray-Curtis similarities from log(n + 1)-transformed gene numbers showing overall variation in nitrate and nitrite reductase gene abundances among sites (H, Hythe; A, Alresford; and B, Brightlingsea). ANOSIM R statistics were as follows: for the comparison of data from all sites, 0.564; for data from Hythe and Alresford, 0.037; for data from Hythe and Brightlingsea, 0.963; and for data from Alresford and Brightlingsea, 0.704. R values range between 0 and 1 (0, identical; 1, no similarity).

