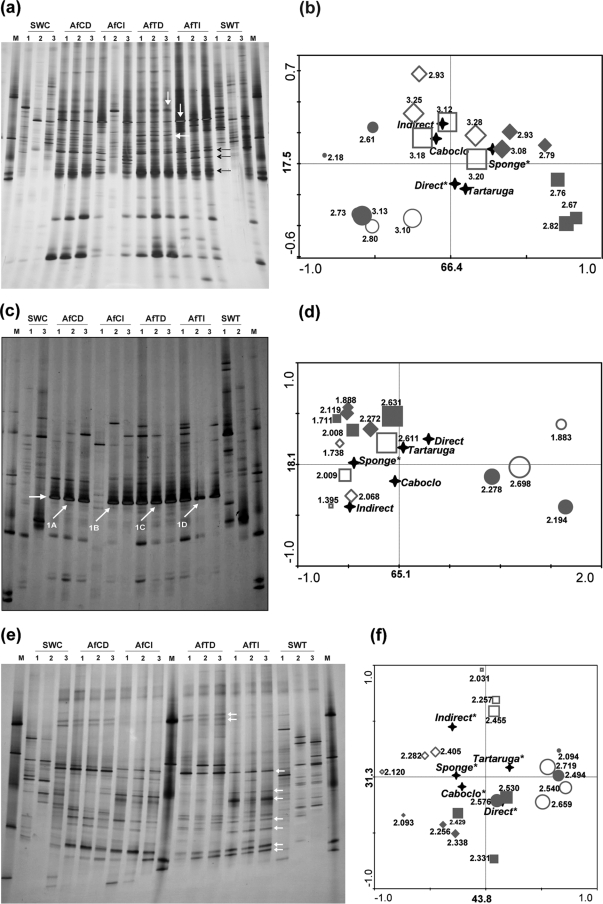
FIG. 2.
PCR-DGGE 16S rRNA gene fingerprints of A. fulva and seawater DNA samples generated with “total-community” bacterial primers (a) and specific primer systems for Pseudomonas (c) and Actinobacteria (e). The arrows in panels a and e indicate bands that occur in the sponge profiles but not in water. Some of these bands, especially those in panel e, are characteristic of a specific DNA extraction strategy. The arrows in panel c show bands that were cloned and sequenced. Corresponding ordination biplots of PCR-DGGE fingerprints and qualitative environmental variables are shown in panels b, d, and f. Symbols: ⧫, A. fulva from Caboclo Island extracted directly (AfCD); ⋄, A. fulva from Caboclo Island extracted indirectly (AfCI); ▪, A. fulva from Tartaruga beach extracted directly (AfTD); □, A. fulva from Tartaruga beach extracted indirectly (AfTI); •, surrounding seawater from Caboclo Island (SWC); ○, surrounding seawater from Tartaruga beach (SWT). Shannon's indices of diversity are shown for each sample next to symbols. Symbol sizes correspond to their estimated diversity indices. Labels displayed on the diagram axes refer to the percentage variations of PCR-DGGE ribotypes; environment correlation accounted for the respective axis. The “star” symbols represent the centroid positions of the environmental variables in the diagram. Variables that significantly (P < 0.05) influence the bacterial community composition are indicated by an asterisk.

