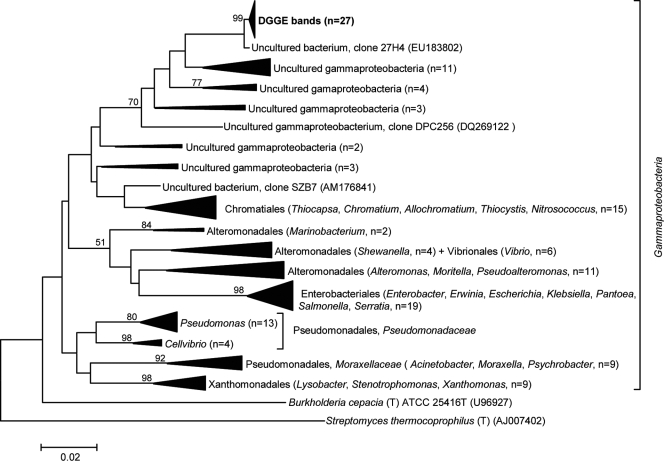
FIG. 3.
Evolutionary relationships of 145 gammaproteobacterial 16S rRNA sequences. Twenty-seven sequences retrieved from a dominant “Pseudomonas” band observed to be enriched in A. fulva DGGE profiles (Fig. 2c) were included in phylogenetic inference. The evolutionary history was inferred by using the neighbor-joining method (49). The tree is drawn to scale, with branch lengths in the same units as those of the evolutionary distances used to infer the phylogenetic tree. The evolutionary distances were computed by using the Kimura two-parameter method (29) and are in the units of the number of base substitutions per site (note the scale bar). Bootstrap values (1,000 repetitions) greater than 50% are shown on three nodes. There were a total of 413 aligned nucleotide positions in the final data set. The 16S rRNA gene sequences of Burkholderia cepacia (T) ATCC 25416T (Betaproteobacteria) and Streptomyces thermocoprophilus (T) (Actinobacteria) served as outgroups.

