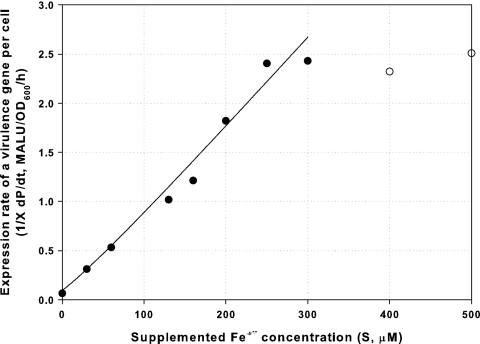
FIG. 6.
Relationship between supplemented-iron concentration and the expression rate of the virulence reporter gene per cell  for DC3000-lux (P. syringae pv. tomato DC3000 hopA1::mini-Tn5 lux Cmr), as described by equation 3. The equation is valid for supplemented-iron concentrations up to 300 μM (data points are obtained from Fig. 5a and Fig. S4 in the supplemental material by the equation
  ). •, experimental results up to 300 μM Fe3+; ○, experimental results over 400 μM Fe3+; —, prediction from equation 3 up to 300 μM Fe3+.

