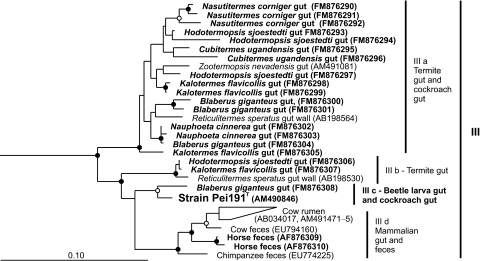
FIG. 6.
Maximum-likelihood tree of all 16S rRNA gene sequences in the intestinal cluster (III), based on an alignment of 910 base positions. Sequences obtained with primer set 3 (this study) are marked in bold. Sequences in clusters IV and V were included in the analysis and used as outgroups (not shown). In both trees, node support is indicated only if bootstrap values were >70% (open circles) and >95% (filled circles) in both maximum-likelihood and maximum-parsimony analyses.

