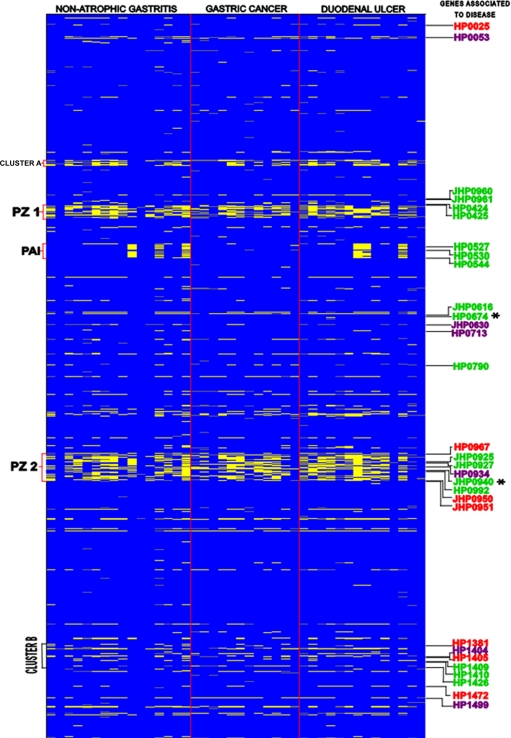
FIG. 1.
Genomotyping of H. pylori isolates from patients with gastroduodenal diseases. The figure is a representation of the entire H. pylori chromosome, which was ordered by combining the maps of strains 26695 and J99 in ascending order, where J99-specific genes are placed at the appropriate sites in the 26695 chromosomal map, starting with HP0001, in each row (top left) and the columns represent the 42 isolates analyzed from three groups of disease. The scanogram indicates genes that are present (blue) or absent (yellow), as well as missing data (gray). Genes associated with disease, i.e., NAG (purple), GC (green), and DU (red), are shown, and genes absent in GC isolates are indicated (*). The locations of PZ1, cag PAI, and PZ2, as well as the small cluster A and a disease-associated gene cluster outside the PZs (cluster B), are indicated.

