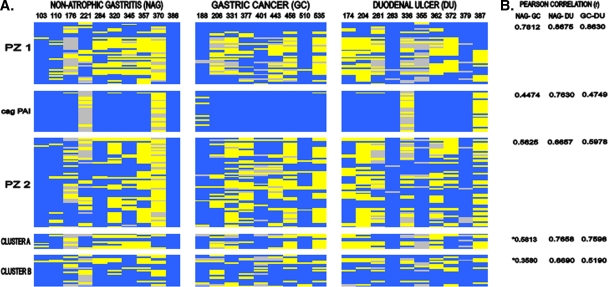
FIG. 2.
Genomic comparison of H. pylori isolates in variable regions among patients with different gastroduodenal diseases. (A) The scanogram shows PZ1 (JHP0954 to HP0494), the cag PAI (HP0520 to HP0547), PZ2 (JHP0914 to HP1009), cluster A (HP0335 to HP0346), and cluster B (HP1381 to HP1426) after combination of the 26695 and J99 chromosomal maps (left). Patients with NAG, GC, and DU are indicated at the top. (B) Comparison of differences in genetic content in each region by analysis of the Pearson correlation coefficient (r). *, values are not statistically significant (P > 0.05).

