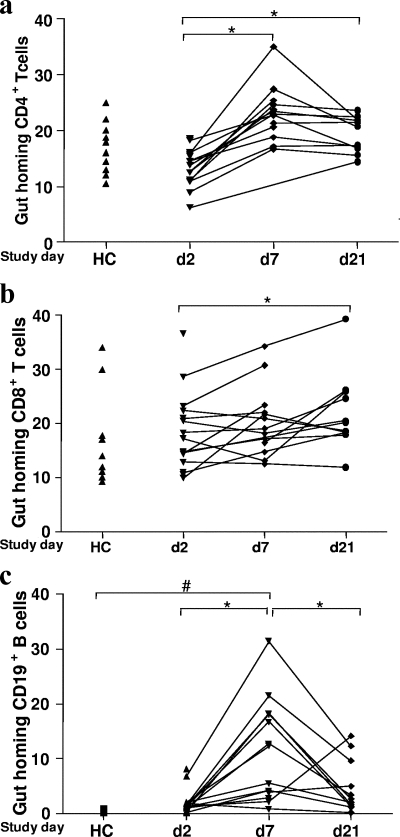
FIG. 1.
Expression of gut-homing T (a and b) and B (c) cells in blood after cholera infection and in healthy controls. Flow cytometric analyses were carried out using separated PBMCs for quantification of β7-expressing T and B cells. Lymphocytes were first gated in forward and side scatter, and then T and B cells, respectively, were gated according to the staining pattern. Levels are shown for patients during the acute stage on day 2 (d2) and during convalescence on day 7 (d7) and day 21 (d21) after the onset of diarrhea, as well as for healthy controls (HC). The symbols indicate the percentages of different cells. *, P < 0.05 for a comparison of patients on different days following infection; #, P < 0.05 for a comparison of patients in different phases of the disease and healthy controls. The paired t test and Mann-Whitney U test were used for statistical analysis where necessary.

