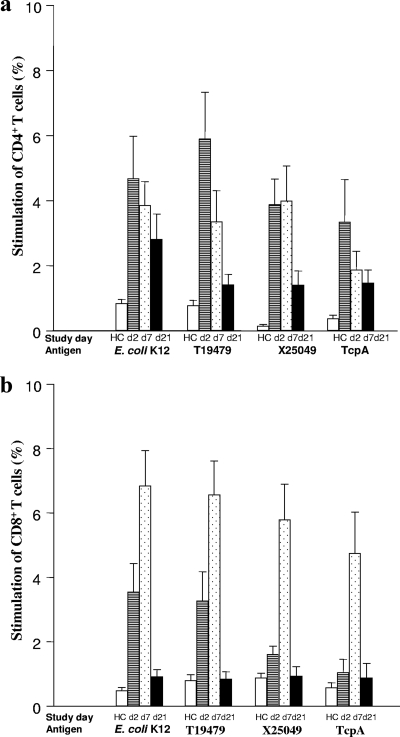
FIG. 2.
Antigen-induced stimulation of PBMCs with membrane protein antigens of V. cholerae (T19479 and X25049) and E. coli K-12, as well as TcpA: responses of CD4 (a) and CD8 (b) T cells after stimulation at the acute stage on day 2 (d2) and at convalescence on day 7 (d7) and day 21 (d21) after the onset of diarrhea. Lymphocytes were first gated in forward and side scatter, and then T and B cells, respectively, were gated according to the staining pattern. Data for healthy controls (HC) are also shown. The proportions of cells that underwent cell division after stimulation with antigens based on incorporation of CFSE are indicated. Each bar indicates the frequency for different cells for patients or healthy controls (geometric means and standard errors of the means are shown). The paired t test and Mann-Whitney U test were used for statistical analysis where necessary.

