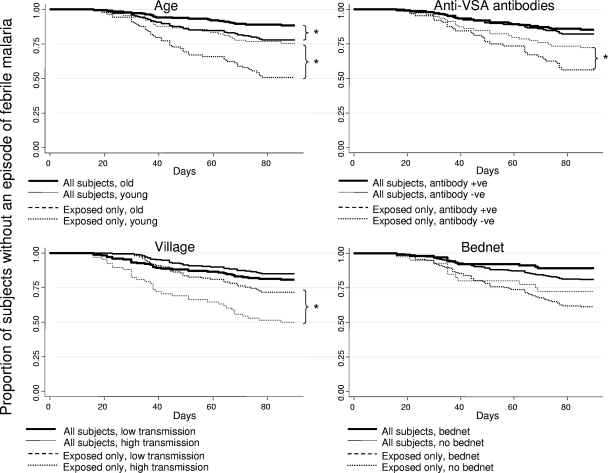
FIG. 4.
Survival plots for time to febrile malaria before and after “unexposed” children were excluded. Statistically significant differences (P < 0.05) as determined by Cox regression are indicated by an asterisk. Children are divided into two categories according to age (old [44 to 82 months] versus young [12 to 44 months]), according to levels of antibody to VSA (high [15 to 85% recognition] versus low [0 to 15% recognition]), according to village (high transmission versus low transmission), and according to bed net use. The plots are survival plots for each categorization of children. Each plot shows the results of the analysis of all subjects and also a repeated analysis after the unexposed children were excluded.

