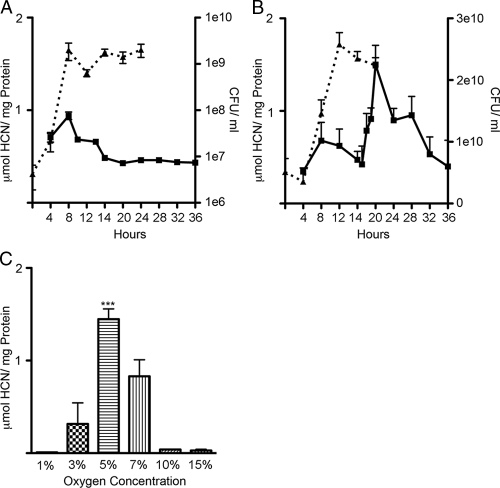
FIG. 1.
PAO1 HCN production in liquid and plate media and under different oxygen tensions. (A) HCN production (solid squares and solid line) by PAO1 in liquid Pseudomonas isolation broth and bacterial CFU/ml (solid triangles and dotted line) over time. (B) HCN production (solid squares and solid line) by PAO1 grown on PIA plates and bacterial CFU/ml (solid triangles and dotted line) over time. (C) HCN production under various oxygen tensions. Statistical significance was determined by one-way ANOVA and the Tukey-Kramer test. ***, P < 0.001.

