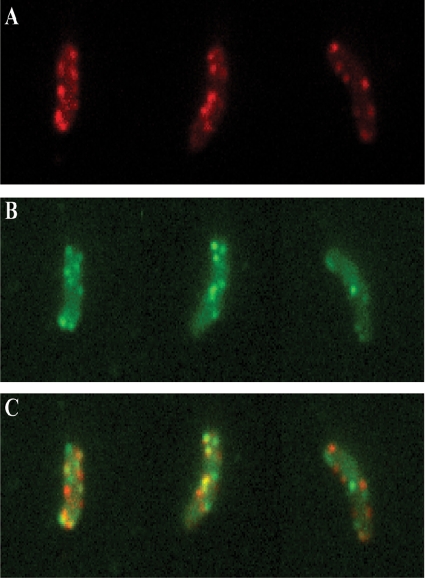
FIG. 9.
GFP-EpsM and mCherry-EpsC colocalization in V. cholerae cells. Cells of PBAD::eps producing both mCherry-EpsC and GFP-EpsM were imaged with DsRed (A) and GFP (B) filters. (C) Overlays of DsRed and GFP signals are shown, with GFP-EpsM in green, mCherry-EpsC in red, and overlapping signals in yellow.

