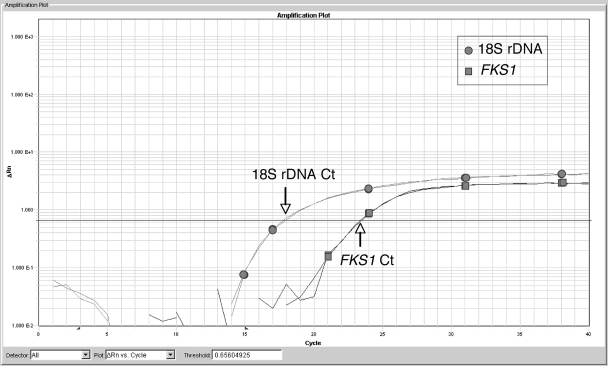
FIG. 3.
Amplification plot of 18S rDNA versus FKS1. An example of copy number determination of 18S rDNA using FKS1 as a single-copy control. The figure is an amplification plot of a TaqMan assay performed using the 18S rDNA primer-probe combination and FKS1 primer-probe combination. Template DNA was taken from the same DNA sample prepared from AF293 and run in duplicate. Note the earlier CT value of 18S rDNA (circles), which is approximately 18.0 (downward arrow) versus the FKS1 CT value (squares), which is approximately 23.4 (upward arrow). The lower CT value for 18S rDNA reflects the greater copy number of the target, since the fluorescence crosses the threshold at a much lower cycle number.

