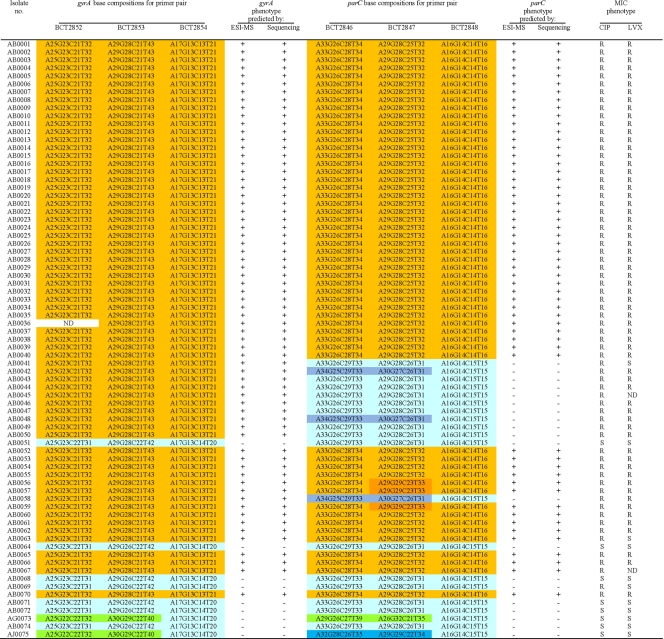
TABLE 4.
Summary for PCR/ESI-MS base composition analysis for gyrA and parC QRDR ampliconsa
+, predicted resistant phenotype; −, predicted susceptible phenotype; R, resistant phenotype determined from MICs; S, susceptible phenotype determined from MICs; ND, not determined. Base compositions are defined in Table 3. Within each column, base compositions that are common to multiple types are similarly colored.

