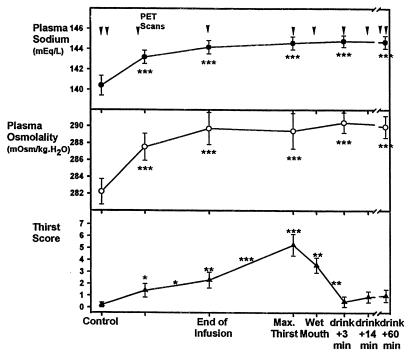
Figure 1.
Diagram of the effect on plasma [Na], plasma osmolality, and thirst score of 10 normal subjects as a result of the sequence of events in the experimental paradigm. After control estimations and baseline PET scans, a rapid i.v. infusion of 0.51 M NaCl was given. Blood specimens were taken and thirst scores were determined midway through and at the conclusion of infusion. Maximum thirst occurred a mean of 43 min later, when a blood specimen was collected and a PET scan was made. The subjects then irrigated their mouths with water. Five mintues later, a PET scan was made. Then the subjects were permitted to drink water to satiation. Blood was collected, and a PET scan was made 3 min after this. A PET scan was made 14, 45, and 60 min after drinking. A further blood specimen was collected for analysis 60 min after drinking. The data are presented as means ± SEM, and the PET scans are designated by arrows. Statistically significant changes are indicated by the asterisks. Asterisks placed above the observation points indicate a significant change from control observations. Asterisks placed between the observation points indicate a significant change between the two observations. ∗, P < 0.05; ∗∗, P < 0.01; ∗∗∗, P < 0.005.

