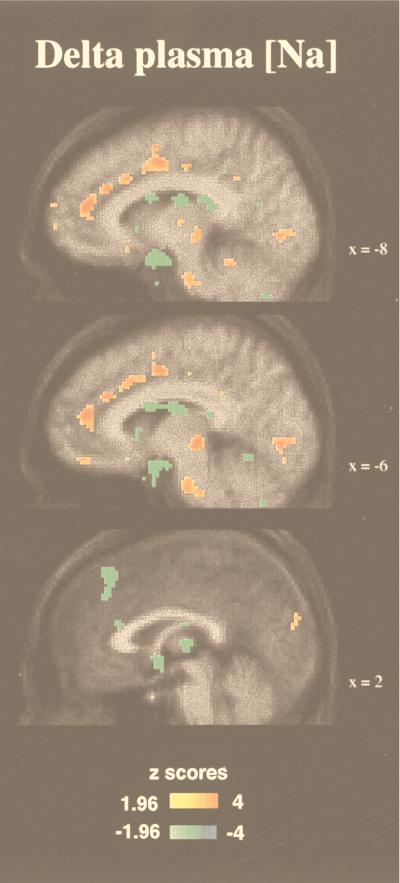
Figure 2.
The correlation of regional cerebral blood flow and the change in plasma [Na] derived from 99 PET scans from 10 subjects after the experimental sequence described in Fig. 1. In these saggital sections, a minus sign designates the left side, a plus sign designates the right side, and numbers indicate distance in millimeters from the midline. The sections are at x = −8, x = −6, and x = +2 and show activations (red-yellow) and deactivations (blue-green). The color coding of Z scores is shown in the figure. The anterior cingulate activations on the left side are evident.

