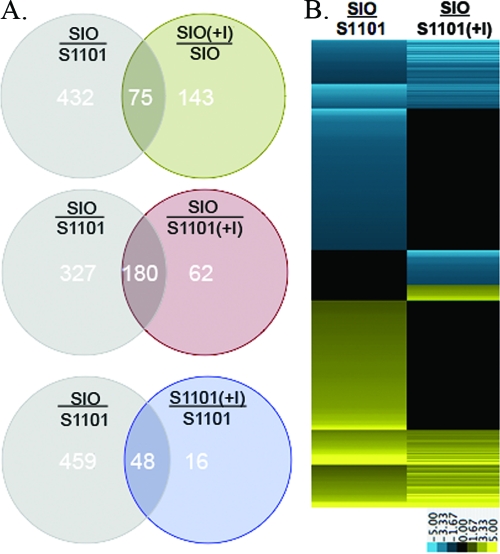
FIG. 4.
Overlap of genes found to be significantly altered in expression between the SIO/S1101 expression profile and remaining pairwise comparisons. (A) Venn diagrams show the shared and unique genes found between the differentially expressed genes of SIO/S1101 grown in LB medium compared with SIO(+I)/SIO, SIO/S1101(+I), and S1101(+I)/S1101. (B) Heat map depicting differences in expression between all genes within the union of the SIO/S1101 and SIO/S1101(+I) expression profiles (569 genes) (see middle diagram of panel A). Compact views of genes are presented using the log2-based color scale shown at the bottom of the panels Yellow, induced; blue, repressed; black, no significant change.

