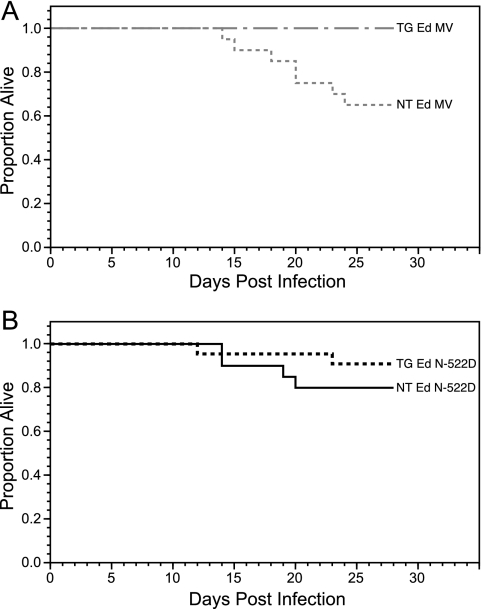
FIG. 2.
Survival curves for Ed MeV-infected NT (n = 20) and TG (n = 23) H-2d mice (A) or Ed N-522D-infected NT (n = 20) and TG (n = 22) H-2d mice (B). Kaplan-Meier statistics were used to generate the survival curves. The Wilcoxon and log-rank tests of survival indicated that survival curves differed significantly among the groups. The Cox proportional hazards models further revealed that survival significantly decreased for Ed MeV-infected NT mice relative to that for TG mice (P < 0.036). Survival rates of Ed N-522D-infected NT and TG mice did not differ significantly from one other.

